Your Client Retention Rate Looks Fine. The Call Notes Say Otherwise.
Two agencies can post the same client retention rate and have opposite years. Here is the formula, the version of it that lies, and where every exit was really decided.
Your Client Retention Rate Looks Fine. The Call Notes Say Otherwise.
Last quarter your client retention rate came back at 85 percent, you put it on the slide, and the room moved on. This quarter two of those retained clients cut their scope in half and a third gave notice in week six, and none of that was anywhere inside the 85.
Client retention rate is the share of the clients you started a period with who are still with you at the end of it, written as the clients you finished with, minus any you won along the way, divided by the clients you started with, times 100. It counts logos kept. It says nothing about why anyone stayed, and nothing about why anyone left.
This piece walks that formula on a twelve-client roster, shows the version of it that quietly lies to you, sets two agencies with the identical rate side by side, and then points at the place where the reason for every one of those exits was actually recorded: on the calls, weeks before anyone touched a renewal.
The Client Retention Rate Formula, And The Client It Can't See
The rate came out of subscription businesses, where a customer is a line on a recurring invoice and "still here" has a clean yes or no. Agencies borrowed the arithmetic without the clean invoice, and most of the confusion starts right there.
The standard formula has three inputs and one trap. Take the clients you had on day one of the period (call it S), the clients you have on the last day (E), and the clients you signed during the period (N). Retention is ((E minus N) divided by S) times 100. Subtracting N is the part people skip, and it matters: without it, one strong sales quarter would paper over a retention problem, because fresh logos would pad the ending count. Promethean Research lays the formula out the same way.
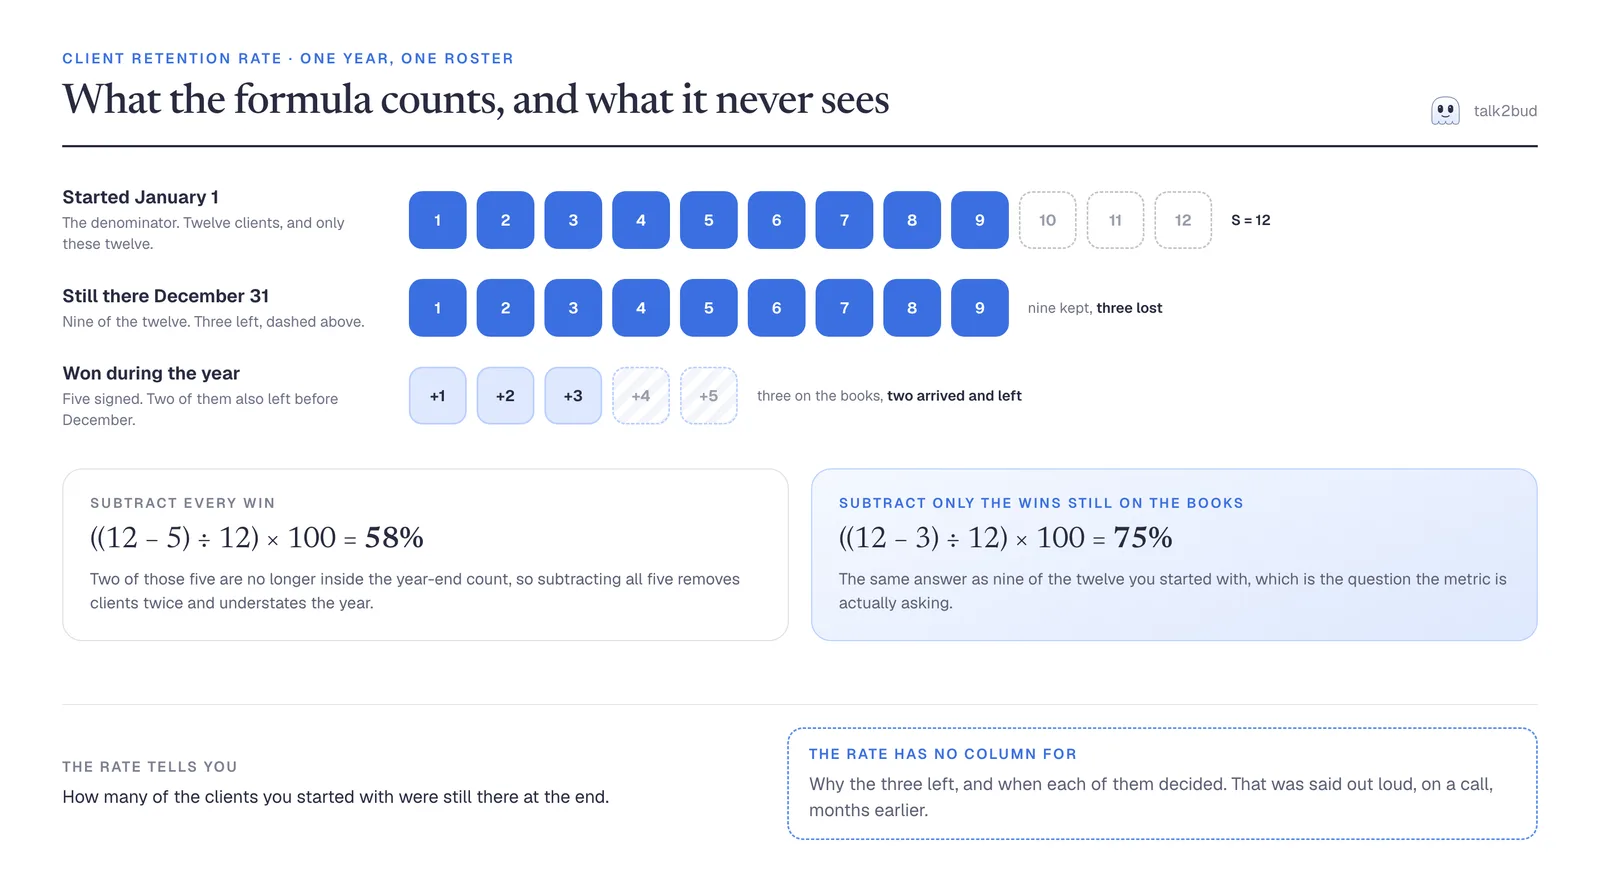
Put twelve clients on the books January 1, so S is 12. By December 31, nine of the original twelve are still active and three are gone. During the year you also signed five new clients, but two of those five churned before December. Here is the trap. E, the clients on the books at year end, is 12: nine survivors plus three of the five new ones. Feed in N as all five wins and you get ((12 minus 5) divided by 12) times 100, which is 58 percent, and it understates you, because two of those five were never in E to begin with. N has to be the new clients still counted in E, which is three: ((12 minus 3) divided by 12) times 100 is 75 percent, the same as nine of the twelve you opened with. That is the number the metric is actually asking for.
Now notice who dropped out of the arithmetic completely. The two clients you won and lost inside the same year touch neither S nor the corrected E. A client can arrive in March, sour by September, and leave in November without moving your retention rate by a single point. For an agency that runs on project work and short engagements, that invisible client is not a rounding error. It is a slice of the year the number will never account for.
Two Agencies, One Number, Opposite Years
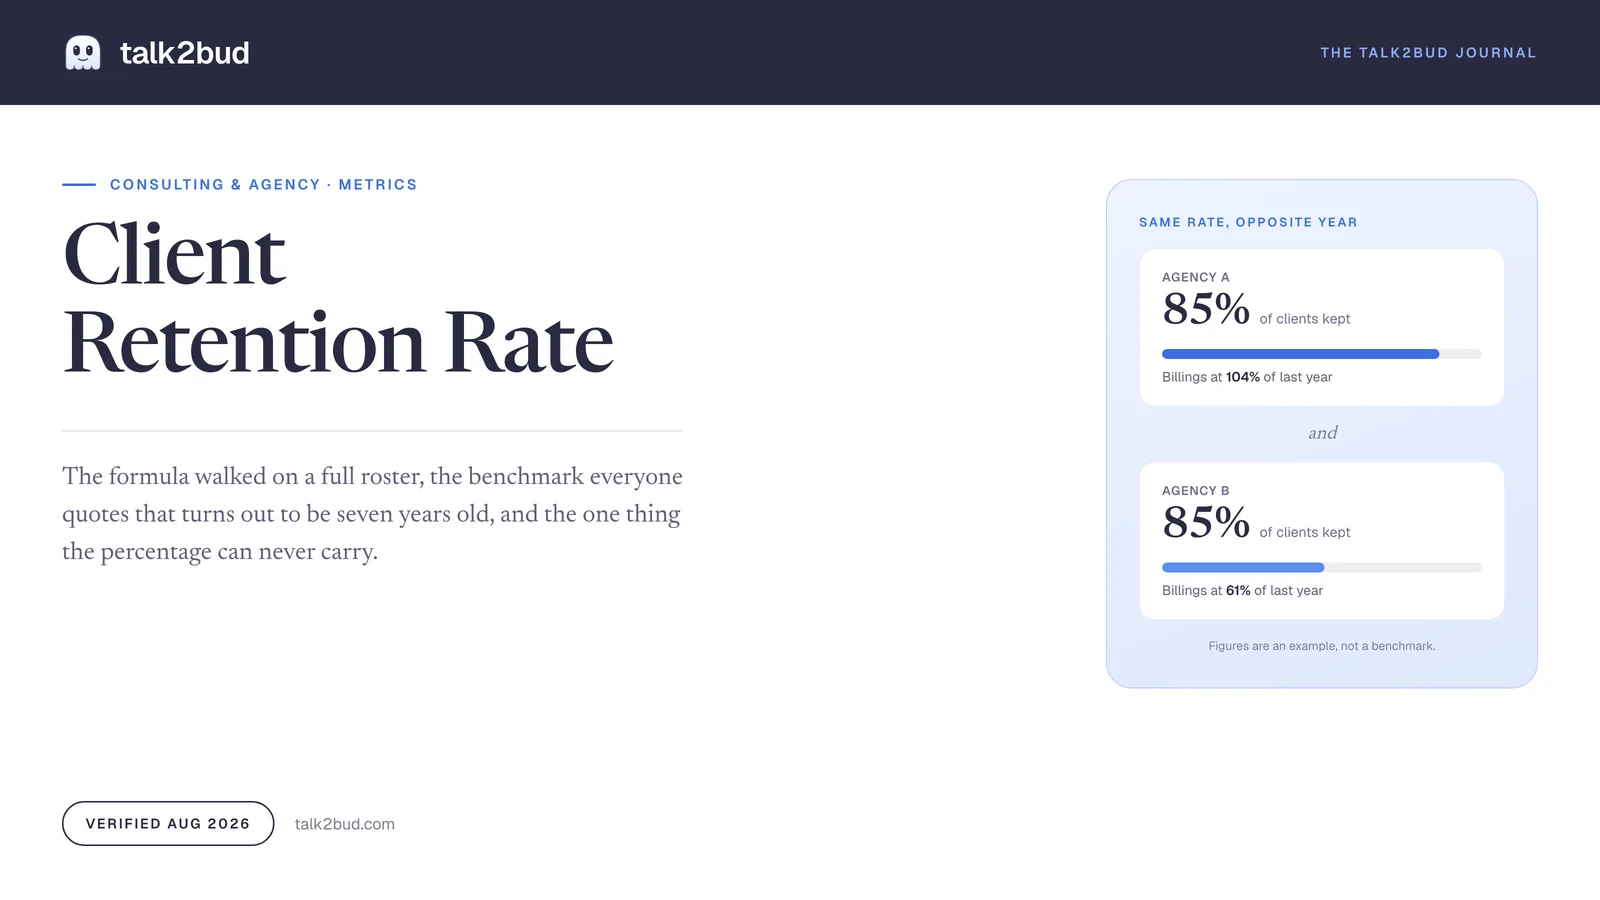
Two agencies close December at the same client retention rate, 85 percent of logos kept, and their years could not be less alike. The figures below are an example built to show the point, not a benchmark.
Agency A held seventeen of its twenty retainers. The three it lost were small, and the seventeen it kept grew: a couple picked up a second workstream, one signed a bigger annual deal. Billings finished at 104 percent of last year. Agency B also held seventeen of twenty. Its three departures, though, were its largest accounts, and half the survivors quietly trimmed their scope at renewal. Billings came in at 61 percent of last year. Same logo retention, same 85 on the slide, and one agency is hiring while the other is drafting a layoff memo.
The rate counts heads, not dollars, so it cannot tell these two apart. Which accounts grew, which shrank, and why, is the whole gap between a good year and a bad one, and it sits entirely outside the percentage. That gap has a name, and the next section gives it one.
Logo, Revenue, And Net: Rates That Disagree On Purpose
What separated Agency A from Agency B was not a better retention rate. It was a second and a third one. Retention is a family of metrics, and reaching for the wrong member is how a shrinking book hides behind a healthy headline.
| Rate | What it counts | The question it answers | What it is blind to |
|---|---|---|---|
| Logo (client) retention | Clients kept, as a headcount | Whether you are losing relationships | Whether the kept clients spend more or less |
| Gross revenue retention | Recurring revenue kept, before any expansion, capped at 100% | How much of last year's book is leaking | Growth from your existing clients |
| Net revenue retention (NRR) | Revenue kept, plus expansion, minus contraction | Whether the existing book is growing or shrinking | How many individual logos you lost |
| Churn rate | The inverse: clients or revenue lost | How fast the leak is running | Everything about why |
Read logo retention when the worry is relationships and referrals, because a lost client takes their word of mouth out the door with them. Read gross revenue retention when you want the honest floor, the share of last year's money that survived before any upsell flatters it. Read net revenue retention when someone asks whether the agency is growing without new business: Agency A's 104 percent and Agency B's 61 percent are NRR, and NRR is the number that finally told their two stories apart. Promethean Research puts the split plainly: "When you calculate logo retention, you count clients. When you calculate revenue retention, you count dollars."
What A Healthy Rate Hides
A rate you have computed correctly still carries four problems the guides that publish it rarely raise.
The benchmark you compare against is not a fact. Half the results that rank for this topic will tell you professional services keep 84 percent of their clients, and trace it, if they trace it at all, to a Statista figure from 2018. CustomerGauge's B2B panel, updated in June 2026, puts professional services at 73 percent instead (CustomerGauge). Eleven points apart, both handed out as "the average," one of them seven years old, and neither showing a sample size you can check. A number you cannot audit is a mood, not a target.
A rising rate can be arithmetic, not improvement. This is the finding that should unsettle anyone who reports the trend line. Fader, Hardie, Liu, Davin and Steenburgh, writing in the Journal of Interactive Marketing (2018), show that cohort retention rates climb over time "purely due to cross-sectional heterogeneity; an individual customer's propensity to churn does not change over time" (study PDF). In plain terms: the clients most likely to leave go first, so the ones who remain were always the loyal type, and the average drifts upward on its own. Your retention rate can rise in the same year you get worse at keeping the clients you win now.
A loyal client is not automatically a profitable one. Reinartz and Kumar tracked 16,000 customers across four company databases for Harvard Business Review and found the link between loyalty and profit far weaker than loyalty programs assume (HBR). Some of the clients propping up your retention rate are the ones eroding your margin: slow to pay, heavy on scope, light on fee. Retention scores them as a win anyway.
And the rate goes silent exactly where the two sides disagree. Setup's 2024 Marketing Relationship Report, drawn from more than 400 contributions, found that "48% of Clients cite delivery issues as the #1 reason they fire an agency, but only 18% of Agencies see this as a top challenge" (Setup). Agencies rank delivery seventh, behind leadership changes and budget cuts. The single biggest reason clients walk is the one agencies most underrate, and no percentage will ever flag the mismatch, because the argument is about what happened in the work and in the conversations, not in the ledger. If delivery is the ground clients actually judge you on, it helps to score the client meeting itself against a rubric rather than wait for the renewal to grade it for you.
The Reason Was On A Call, Months Before The Renewal
Every gap above has the same shape. The rate records the outcome and loses the cause. A client downgraded, and the percentage moved. Why they downgraded, and the week they privately decided to, is not in the spreadsheet. It is in the monthly review where they called the reporting "a lot to sit through," in the QBR where a new stakeholder asked a question nobody circled back on, in the check-in where a favor hardened into unbilled scope. The renewal was settled on calls, weeks or months before anyone updated a cell.
That is the part of the loop talk2bud is built to hold: keeping the calls where the reasons live, and reading each one back against what a healthy account is supposed to sound like.
- Capture the client calls, no bot in the room. Point talk2bud at the monthly review or the QBR and it records straight from your Mac's system audio, so the client never watches an extra attendee called "Notetaker" slide into the meeting. No bot on the invite is not a licence to record on the quiet: you still tell the client you are recording, and the app's consent flow exists to keep that the default. It is a Mac app, Apple Silicon, in English, built to keep the conversation rather than feed a CRM.
- Read each call against a client Lens. A Lens is an analysis playbook for one kind of meeting. Point a Client review Lens at that recording, or write your own that listens for the signals that run ahead of a downgrade, an unanswered question, scope added without a change order, a champion who has gone quiet, and talk2bud evaluates the transcript against it once the call ends.
- Get the exit signals, tied to the line that raised them. Instead of a percentage in March, you get, the same afternoon, the action items with an owner and a due date and the quiet risks pulled from what was actually said. A nervous one-on-one stays between the two people in it and never lands in a shared channel by default; the patterns worth the whole team are the ones you carry into a channel on purpose.
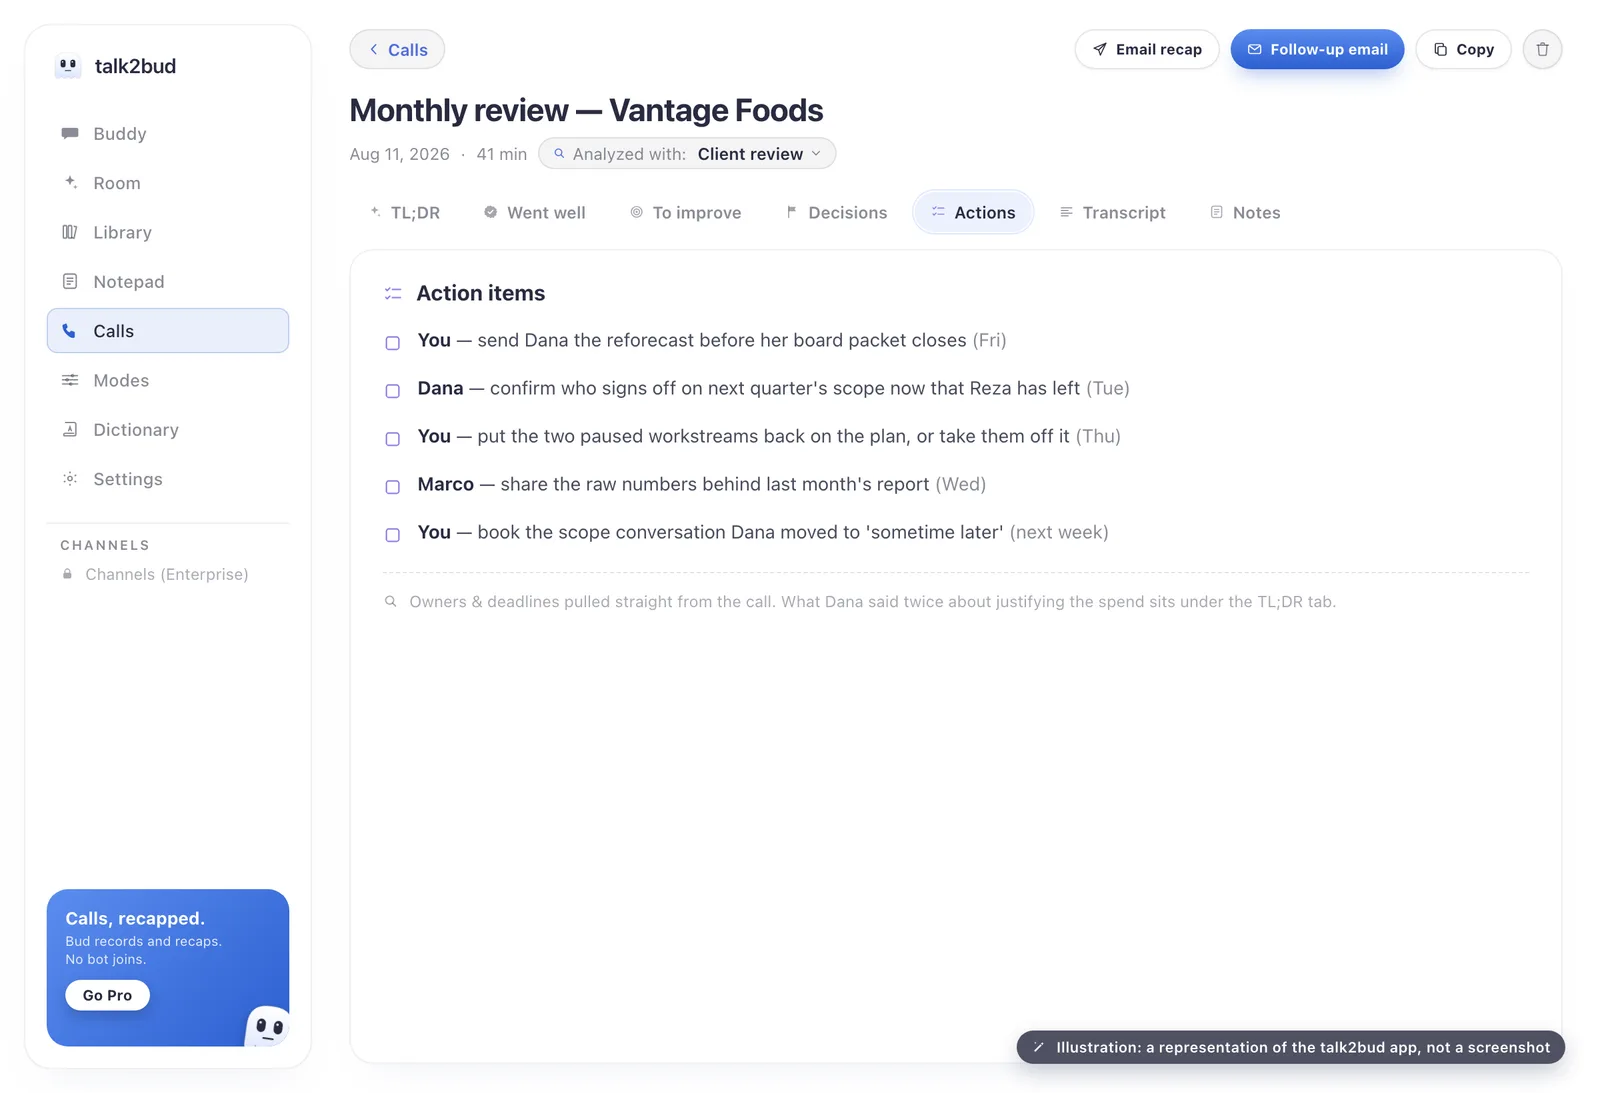
None of this moves the retention rate you report. It moves whether you saw the reason coming while you could still do something about it. You can capture the client call from your Mac without a bot in the room and read it back the same day. The percentage keeps score; the calls are where the score gets decided.
The Questions Behind The Rate
What is client retention rate?
Client retention rate is the percentage of clients a business keeps over a defined period, counting logos rather than revenue. It is the clients still active at the end of the period, minus any won during it, divided by the clients present at the start, times 100. A high client retention rate means few relationships were lost, but on its own it says nothing about whether the kept clients spent more or less than the year before.
How do you calculate client retention rate?
To calculate client retention rate, take the clients at the end of the period (E), subtract the clients you gained during the period (N), divide by the clients at the start (S), and multiply by 100: ((E − N) ÷ S) × 100. Subtracting the newly won clients is what stops a strong sales month from disguising a retention problem. Count N as the new clients still active at period end, or a client won and lost inside the same period will quietly distort the result.
What is a good client retention rate for a marketing agency?
There is no single good client retention rate for a marketing agency, because it depends on whether the work is retainer or project based. Agency consultant Karl Sakas suggests being concerned if annual client turnover on retainers runs higher than 20 percent, while project agencies with a strong pipeline can reasonably see 30 to 50 percent turnover a year. Judge your client retention rate against your own model and your prior years, not against a borrowed industry average.
What is the average client retention rate for SEO agencies?
There is no reliable published average client retention rate specific to SEO agencies. The 84 percent figure often quoted for professional services traces to a 2018 Statista number, while CustomerGauge's 2026 B2B panel puts professional services nearer 73 percent, and neither is SEO-specific or shows its sample size. Treat any single SEO retention benchmark with suspicion and track your own agency's rate over time instead.
What is the Excel formula for retention?
The Excel formula for retention rate is =((E2-N2)/S2)*100, where E2 is how many clients you have at period end, N2 is the clients gained during it, and S2 is the clients at the start. Format the cell as a number or a percentage to read the result. To track it month over month, give each period its own row and copy the formula down, so the rate recalculates as the client counts change.
Start With The Three Renewals You Are Least Sure Of
Your client retention rate will still read 85 next quarter. Before it does, do one thing this week: pick the three accounts you are least sure will renew, and instead of guessing, read what each of those clients actually said on their last two calls. The reason they are wavering is usually already in there, which means you find it while you can still act, not in the exit note. That is the difference between a metric that reports the past and a habit that changes it. To keep the client-side desk landing in your inbox, subscribe to the Journal and take the next read with you.
Verified August 2026 against Promethean Research, CustomerGauge, the Setup 2024 Marketing Relationship Report, Sakas & Company, Harvard Business Review, and Fader et al. (Journal of Interactive Marketing, 2018), linked above. The twelve-client roster and the two-agency comparison are examples chosen to show the method, not measured benchmarks.